
Churn is the silent killer of SaaS growth. For product-led and customer success teams, understanding why customers leave and acting on those insights is the difference between compounding growth and a leaky funnel. In my guide below, I highlight the churn analysis strategies for 2025, how to measure, analyze, and proactively address churn before it impacts Product Led Growth SaaS bottom line.

Look, the churn landscape has completely shifted in 2025. While everyone was panicking about growth slowing down, something interesting happened with retention. The data tells a story that most SaaS founders are missing.
Here's what's actually happening: B2B SaaS churn dropped to 3.5% monthly in 2025, down from the 7.5% peak we saw in late 2021. But here's the kicker: new sales also dropped by 3.3% at the same time. What does this mean? Companies that figured out retention are the ones still growing while their competitors are scrambling for new logos.
If you're hitting under 5% annual churn, you're in good territory. Above that? Time to dig deep into what's actually causing people to leave.
Table of Contents
What is Churn and Why Does It Matter?
Churn is the percentage of customers or revenue lost over a given period. High churn signals product-market misfit, poor onboarding, or lack of ongoing value. For PLG and SaaS, reducing churn is essential for sustainable growth, improving retention, and driving expansion revenue.
The 2025 SaaS Churn Reality Check
Let me break down where the industry actually stands right now, because the benchmarks everyone's been using are outdated.
Based on data from over 1,000 B2B SaaS companies, here's what "normal" looks like in 2025. SMB SaaS companies are seeing 3-7% monthly churn (which translates to roughly 31-58% annually, ouch). Mid-market companies are doing better at 1-2% monthly, and enterprise SaaS is crushing it with 0.5-1% monthly churn.
But here's what's really interesting: most software products lose 70% of their users within three months, with only 39% sticking around after the first month. If you can get people past that 90-day mark, you're golden.
The other thing that's wild? Champion changes at customer accounts are one of the biggest predictors of churn. This isn't just about product fit, it's about relationships.
And pricing? Yeah, it matters more than ever. Companies with higher ARPU (above $250/month) have way lower churn rates. Not because expensive = sticky, but because higher-paying customers typically get deeper integrations and more organizational buy-in. They've got skin in the game.
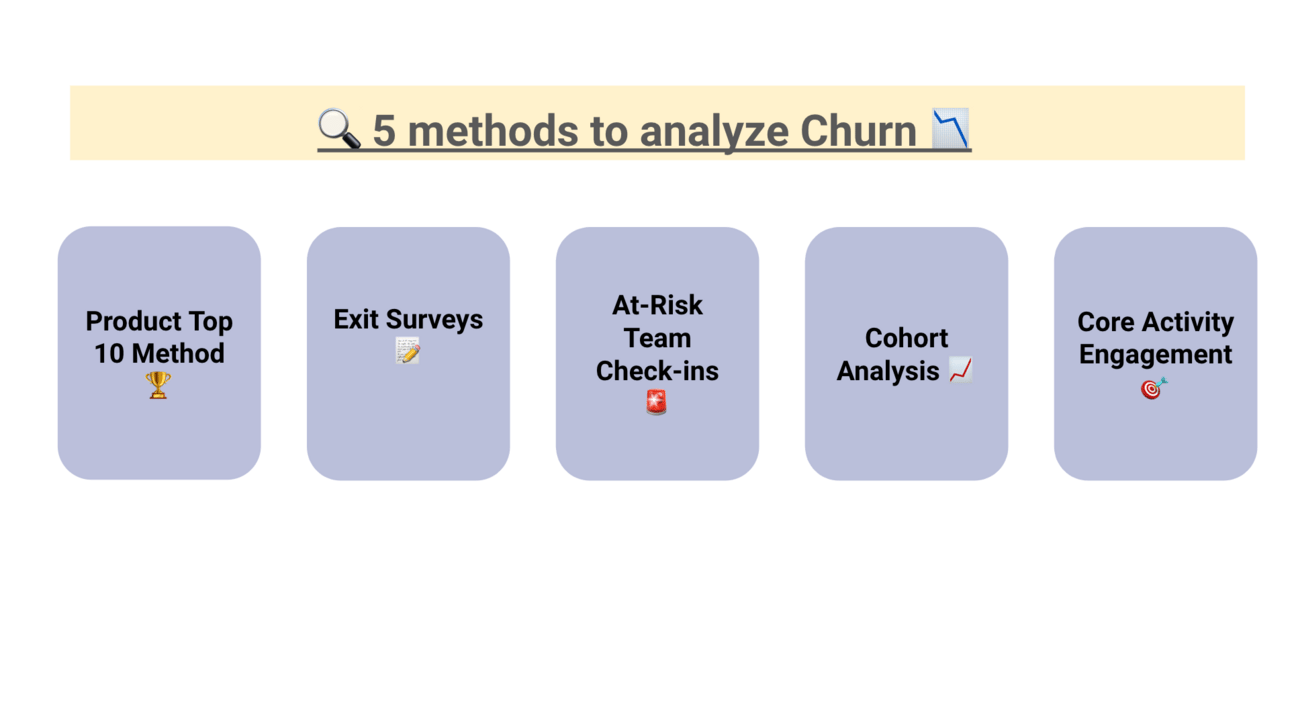
The 5 Key Methods for Churn Analysis
Advanced Churn Analysis That Actually Works
Okay, you've got the basics down. But if you want to separate yourself from the competition, you need to think beyond the standard playbook. Here's what the companies with sub-5% churn are doing differently.
Behavioral cohort analysis is where the magic happens. Don't just group customers by when they signed up, group them by what they actually do. Track users who complete specific onboarding steps versus those who don't. Simple actions early on can dramatically impact retention rates.
Predictive churn scoring is becoming table stakes. You're basically using machine learning to calculate churn risk weeks before it happens. Predictive analytics tools are becoming increasingly accurate at identifying churn risk weeks before it happens. That gives your CS team weeks to intervene instead of scrambling after someone's already mentally checked out.
Here's one most people miss: champion churn detection. Your best contact at the customer account leaves, you don't find out until their email bounces, and suddenly the renewal is in someone else's hands, someone who doesn't know who you are. Track internal champion changes like your revenue depends on it, because it does.
The companies winning in 2025 aren't just analyzing churn. They're predicting and preventing it with systematic, data-driven playbooks that turn insights into customer success interventions before customers even know they're thinking about leaving.
Product Top 10 Method
Summarize and rank the top ten reasons customers churn by gathering insights from your customer-facing teams. This method helps you quantify the financial impact of each churn driver and prioritize fixes that will yield the greatest retention gains.
“Gather your customer-facing teams and list the top ten reasons for churn. Quantify the financial impact and use this to influence product and business decisions.”
Exit Surveys and Calls
Conduct thorough exit interviews and post-mortems to understand why customers leave. Use this feedback to anticipate and prevent future churn.
“Don’t let customers leave without a conversation. Exit interviews are gold mines for actionable feedback.”
At-Risk Team Check-ins
Identify customers showing early signs of disengagement, such as reduced usage or missed renewals. Regular check-ins allow you to address issues before they result in churn and demonstrate your commitment to customer success.
“Proactively reach out to customers showing low engagement. Address issues before they escalate and set reminders for regular follow-ups.”
Cohort Analysis
Analyze retention and churn by grouping customers into cohorts based on signup date, product usage, or other relevant criteria. This approach reveals patterns and trends, helping you pinpoint when and why customers are most likely to leave.
“Track retention by customer cohorts, monitor last login dates, active months, and drop-off points to spot patterns and blockers in the journey.”
Core Activity Engagement
Monitor how frequently customers engage with your product’s core features (not just logins). A drop in engagement with core-value workflows is a strong early indicator of potential churn. It’s a big red flag for you to intervene before customers decide to leave.
“Monitor usage of core features, not just logins. If customers aren’t engaging with key workflows, intervene early to re-engage and deliver value.”
Read more on 5 methods to analyze churn:
5 churn analysis methods
Why you have so many churn??? 😂
growthwithgary.com/p/5-churn-analysis-methods
Step-by-Step Churn Analysis for PLG
Conduct Exit Interviews. Don’t let customers leave without a conversation. Record calls, gather feedback, and look for patterns in reasons for churn.
“Record calls, gather feedback, and look for patterns in reasons for churn. Every exit is a learning opportunity.”
Rank Churn Reasonings. List and rank churn reasons by recency, frequency, and intensity. Share findings with product and engineering to close the feedback loop.
“List and rank churn reasons by recency, frequency, and intensity. Share findings with product and engineering to close the feedback loop.”
Conduct Product Usage Analysis. Track inactivity, segment by country, company size, or urgency. Use engagement spikes and drop-offs to identify at-risk accounts and intervene quickly.
“Track inactivity, segment by country, company size, or urgency. Use engagement spikes and drop-offs to identify at-risk accounts and intervene quickly.”

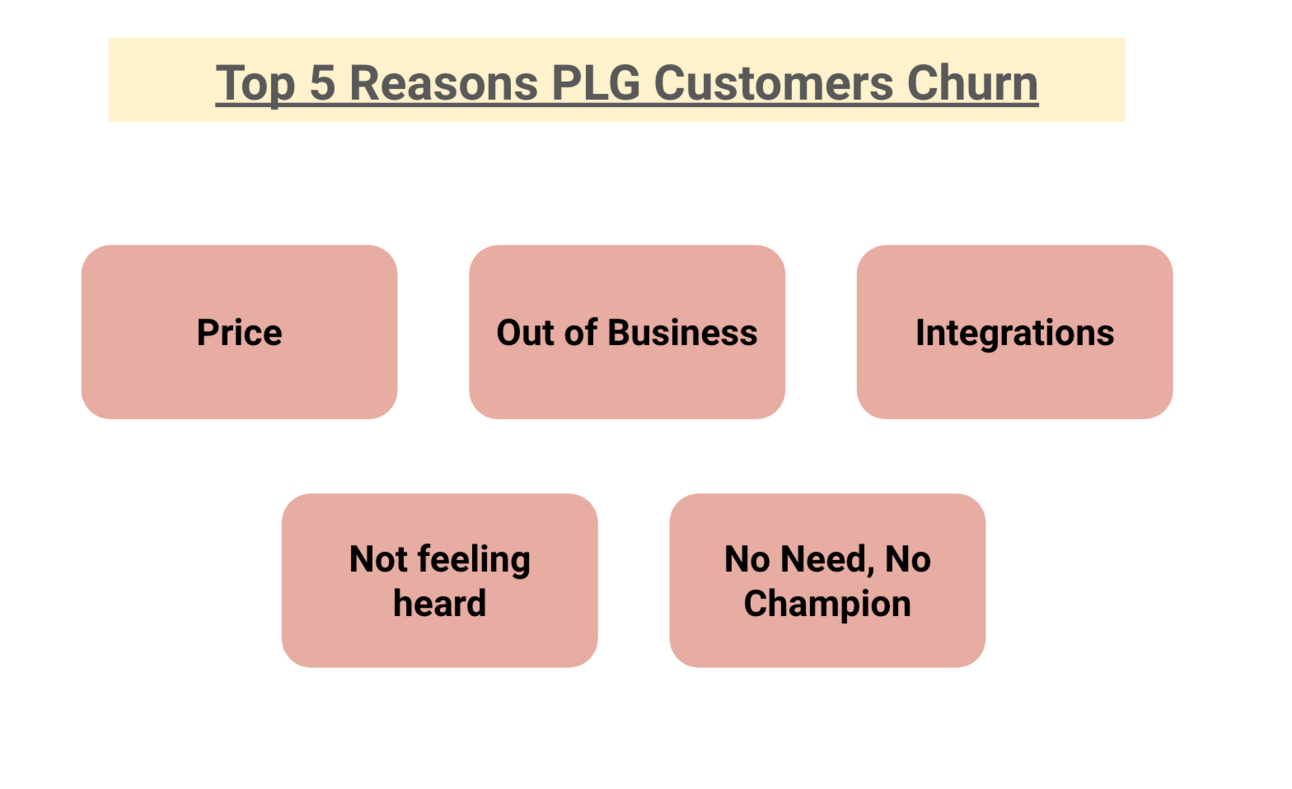
Read more on Product-Led Growth Churn Analysis and Top 5 Reasons for Churn:

Churn Rate: How to Calculate and Benchmark
Churn rate is calculated as:
Churn Rate = Number of Customers Lost in Period / Total Customers at Start of Period
Track both customer churn (logos lost) and revenue churn (MRR/ARR lost). Benchmark against industry standards and segment by plan, cohort, or user type for deeper insights.

Read more about the SaaS churn rate:

The Tools That Actually Make Churn Analysis Actionable
Let's talk tools, because spreadsheets and good intentions won't cut it anymore. The right churn analysis setup makes the difference between reactive fire-fighting and proactive revenue protection.
For churn prediction platforms, you've got options like ChurnZero for real-time scoring with CRM integration, or Gainsight for enterprise-grade customer success with advanced health scoring. These tools are expensive but worth it if you've got the ARR to justify the investment.
If you're bootstrapping or just getting started, analytics and behavioral tools like Amplitude can help with behavioral cohort analysis, and you can build a lot of this yourself. The key metrics you need to track are monthly login frequency, core feature adoption rates, time to first value achievement, support ticket volume per account, and payment failure rates.
Here's the thing about tools, don't get tool-heavy before you understand your churn patterns. Start with your existing CRM, product analytics, and support platform. Combine that data manually if you have to. Once you know what signals actually predict churn in your specific business, then invest in specialized churn software.
The budget-friendly approach that works: Use your existing tools to identify the top 3 churn indicators, set up basic alerts, and create simple intervention playbooks. You can get 80% of the value with 20% of the investment.
Reporting Churn: Metrics and Best Practices
Monthly/Quarterly Churn Reports. Track churn trends, highlight reasons, and quantify revenue impact.
“Track churn trends, highlight reasons, and quantify revenue impact. Use visuals to make the story clear for stakeholders.”
Visualize with Cohort Charts. Use cohort analysis to visualize how different groups of customers (e.g., by signup month or segment) retain or churn over time. Cohort charts reveal when churn is most likely to occur in the customer lifecycle and help you identify which segments need targeted interventions. This approach makes churn data actionable and helps guide product and customer success priorities
“Show retention over time by signup month or segment. Cohort charts make churn actionable.”
Share Insights Org-Wide. Distribute churn analysis findings across departments, product, marketing, sales, and customer success. Cross-functional collaboration ensures everyone understands the drivers of churn and aligns on solutions. Sharing actionable insights encourages accountability and enables teams to work together on strategies that improve retention
“Present findings to execs, product, and customer success to drive alignment and accountability.”

Read more on how to report churn:

CAC, LTV, and the Economics of Churn
Churn directly impacts Customer Lifetime Value (LTV) and the payback period for Customer Acquisition Cost (CAC). Use the CAC:LTV ratio to assess the health and scalability of your business model. A high churn rate means lower LTV and a less efficient growth engine.
“If churn is high, LTV drops, CAC payback stretches, and your growth engine sputters. Churn isn’t just a CS metric, it’s a business model metric.”

»»» Download the Excel CAC LTV Heatmap template here: https://docs.google.com/spreadsheets/d/1qt16CEzHTyCgcg-VFM0uQCWHWIsZk5mzMBPI6gd5Vpk/edit?usp=drive_link
The economic environment has fundamentally changed how SaaS companies think about growth, and the numbers tell the story. SaaS spending per employee jumped 27% to $8,700 in 2024. Contract length matters more than ever, annual contracts show 8.5% churn versus 16% for month-to-month. Higher ARPU customers churn less, but only when onboarding and support scale with their complexity.
Here's the new reality: with acquisition costs rising and sales cycles getting longer, companies are shifting from acquisition-heavy models to land-and-expand strategies. Your churn analysis directly influences this pivot. If you're still burning cash to acquire customers who churn before month 12, you're not building a business, you're funding other people's customer acquisition experiments.
Calculate your churn's impact on CAC payback. If it takes 18 months to payback acquisition costs but customers are churning at month 15, you've got a business model problem, not a retention problem. The companies thriving in 2025 have figured out retention-driven growth. They're not just adding new revenue, they're keeping and expanding what they already have.
Influencing Your Org with Churn and CAC:LTV

Show the CAC:LTV math to executive, nothing gets attention like a shrinking payback window. Use churn data to drive real change.
Use churn analysis and CAC:LTV data to:
Influence product roadmap decisions
Make the case for customer success investments
Prioritize features and fixes that improve retention
Drive alignment between product, marketing, and CS teams
How to Track At-Risk Customers
Build dashboards to monitor engagement and flag at-risk users.
Set up automated alerts for inactivity or drop-offs in core activity.
Use proactive outreach and playbooks to re-engage and retain customers.
Don’t wait for churn to happen. Track engagement, flag at-risk users, and intervene before it’s too late.
Read more Track At-Risk Customers:

The warning signs have evolved since 2020, and what used to predict churn doesn't always apply anymore. Declining session duration is a strong predictor of churn risk. Login frequency falling under 0.3 times per day is another red flag. Core feature usage dropping 40% month-over-month, or no integration setup after 14 days, these are the signals that matter.
But here's what's really changed: the relationship red flags. Champion email bounces or role changes, decreased response rates to CS outreach, support ticket volume that spikes then drops to zero, NPS scores below 6. These relationship signals often precede the usage signals by weeks.
Don't forget the business context red flags either. Company layoffs, budget freezes, merger announcements, leadership changes at the customer account. This stuff happens, and when it does, your renewal is suddenly at risk regardless of how much they love your product.
The 2025 playbook is different. Don't wait for customers to go silent. Use in-app messaging, not just email. Vary your touchpoints. If someone ghosts you, send something personal: a quick video, industry insight, or relevant case study. The companies winning retention battles aren't just tracking signals, they're acting on them with human, personalized interventions.
Turning Churn Analysis Into Revenue Protection
Analysis without action is just expensive reporting. Here's how to turn insights into results without getting overwhelmed by the complexity.
Your first 30 days: Set up automated alerts for your top 3 churn indicators. Create a simple churn reason taxonomy, price, product, champion change, whatever makes sense for your business. Start doing weekly "churn post-mortems" with your team. Not formal presentations, just quick discussions about why people left and what you could have done differently.
Days 30-90: Build behavioral cohorts around your "aha moments." You know that moment when a customer gets it? Track how many people reach it and how it impacts retention. Implement predictive scoring for your highest-value accounts, even if it's just a simple red/yellow/green system. Create intervention playbooks for each major churn reason. Nothing fancy, just "If this, then that" logic.
Beyond 90 days: Deploy machine learning models if you have the data and resources. Build expansion playbooks based on your retention cohort analysis. Integrate churn risk into your sales handoff process so new customers don't fall through the cracks.
The key is starting simple and building systematically. Don't try to solve all of churn analysis in month one. Pick the biggest problem, fix it, then move to the next one. The companies with the lowest churn didn't get there overnight. They got there by consistently improving their retention systems one month at a time.
Bottom Line: Churn Analysis Isn't Optional in 2025
Here's the reality: churn analysis isn't something you do once and check off your list. It's an ongoing system that separates growing SaaS companies from ones that plateau.
The companies crushing it in 2025 have figured out that retention is their new growth engine. They're not just tracking churn, they're predicting it, preventing it, and using those insights to build stronger products and relationships.
Start where you are. Pick your biggest churn problem and fix it. Build simple systems before you invest in complex tools. Track your signals, act on them quickly, and remember that every customer who doesn't churn is worth 5-25 times more than acquiring a new one.
Your churn rate isn't just a CS metric. It's a business model metric. Treat it that way, and you'll be ahead of 90% of your competition who are still playing defense instead of offense.
The companies with the lowest churn rates didn't get there overnight. They got there by consistently improving their retention systems, one insight at a time. Now it's your turn.
Read more about here:
P.S. If you have 2 min, please take this three-questions survey about this newsletter for me @ https://tally.so/r/3EaPyl
I write daily*** about my learning on launching and leading PLG. Feel free to subscribe.

I am Gary Yau Chan. 3x Head of Growth. Product Growth specialist. 26x hackathon winner. Building ClarityInbox. I write about #PLG and #BuildInPublic. Please follow me on LinkedIn, or read about what you can hire me for on my Notion page.


![PLG vs SLG: How to Choose? [Framework]](https://media.beehiiv.com/cdn-cgi/image/format=auto,width=720,fit=scale-down,onerror=redirect/uploads/asset/file/add0e243-a663-4f5b-81a5-0554cd609c17/image.png)
![LTV CAC Ratio Payback Formula [Free Download Template]](https://media.beehiiv.com/cdn-cgi/image/format=auto,width=720,fit=scale-down,onerror=redirect/uploads/asset/file/44a1862d-a0e4-478c-b87f-038cdd79daef/Screenshot_2024-09-18_at_3.44.16_PM.png)


